Industrial SCADA platform
See your process as it runs with Predixi IO
Draw your process with its own symbols and bind the field signals. The shift sees equipment states, alarms and history in one project.
Industrial SCADA platform
Draw your process with its own symbols and bind the field signals. The shift sees equipment states, alarms and history in one project.
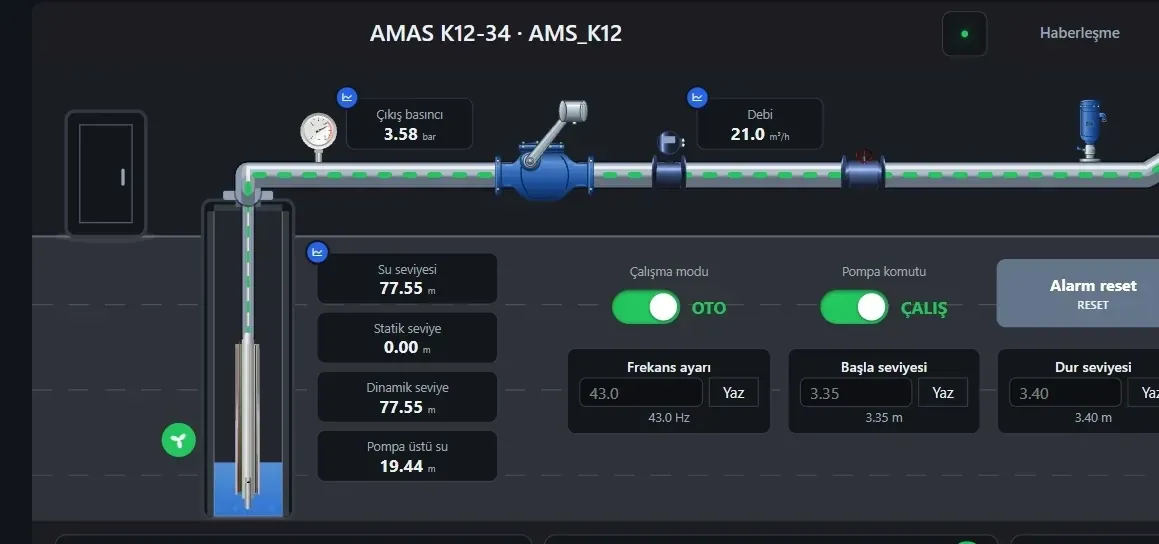
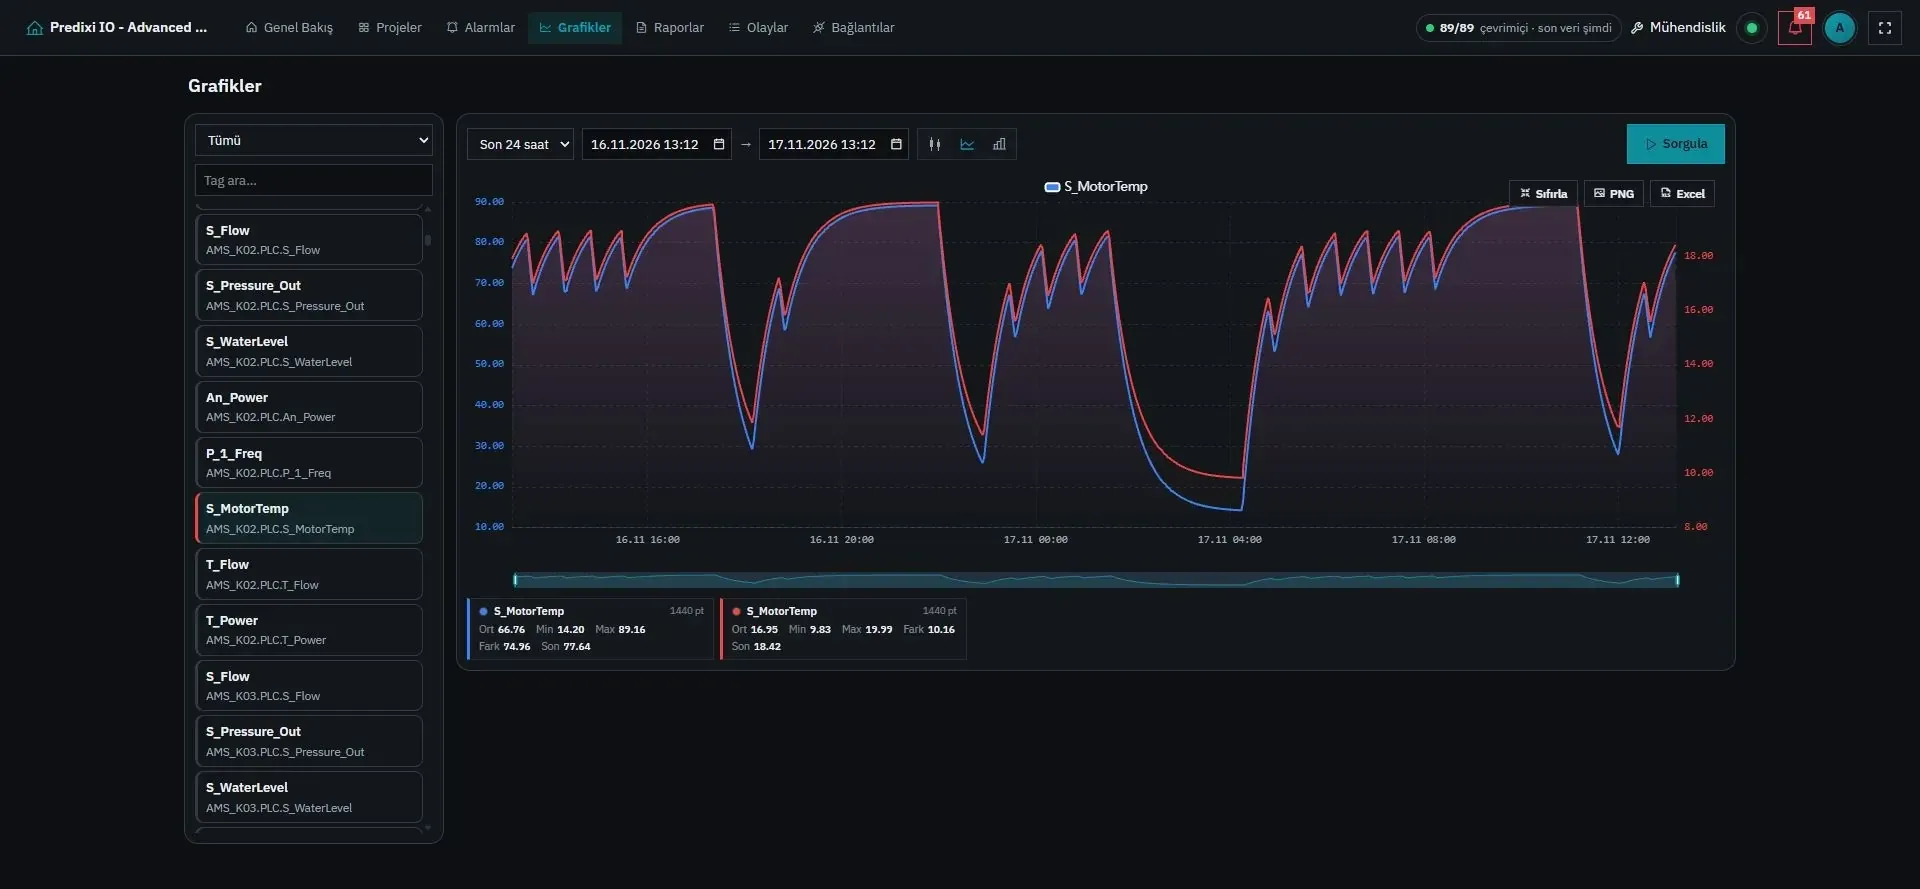
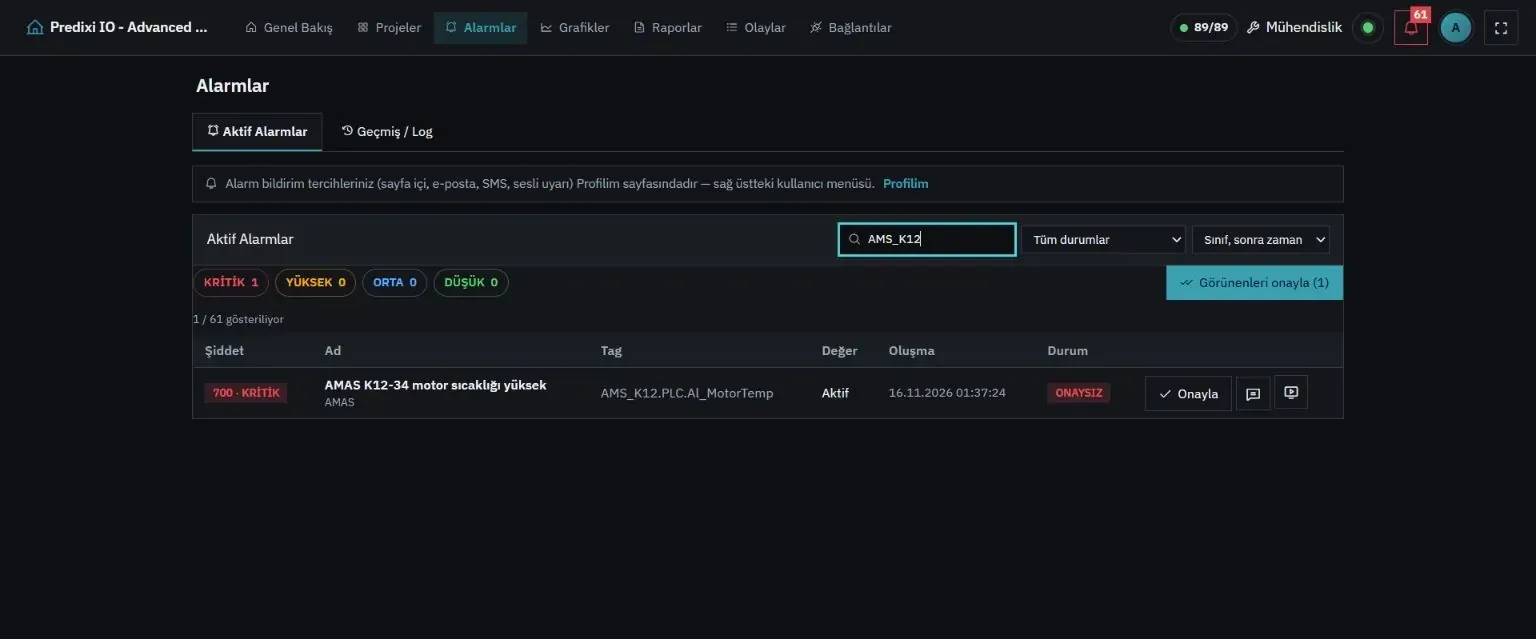
The same tools adapt to different automation processes: a well, a pumping station or a production line.
Set up field channels and devices, read from OPC UA servers, and derive meaningful values with Virtual Tags and Tag Link.
Place symbols on the drawing, bind indicators to field readings, then add alarm definitions and workflows.
Choose how teams, business applications and AI tools can reach the project.
The screen an engineer draws becomes the screen for the operator, the control room and the field team.
Screen design
Place a pump symbol on the drawing and bind its outlet pressure indicator to the field reading. The motor’s alarm bit drives the indicator colour, and the published screen shows operators the live values.
Explore screen design(opens in a new tab)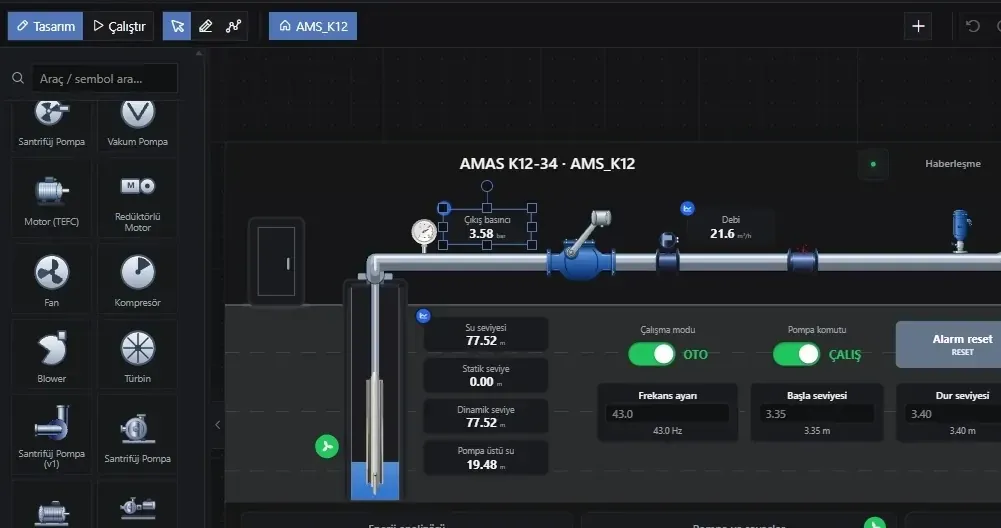
Operator screens · HMI
Search the Projects directory by screen name, or use the screen picker on an open drawing to switch to other wells in the same project. Each asset’s measurements open in its own process view.
Explore operator screens(opens in a new tab)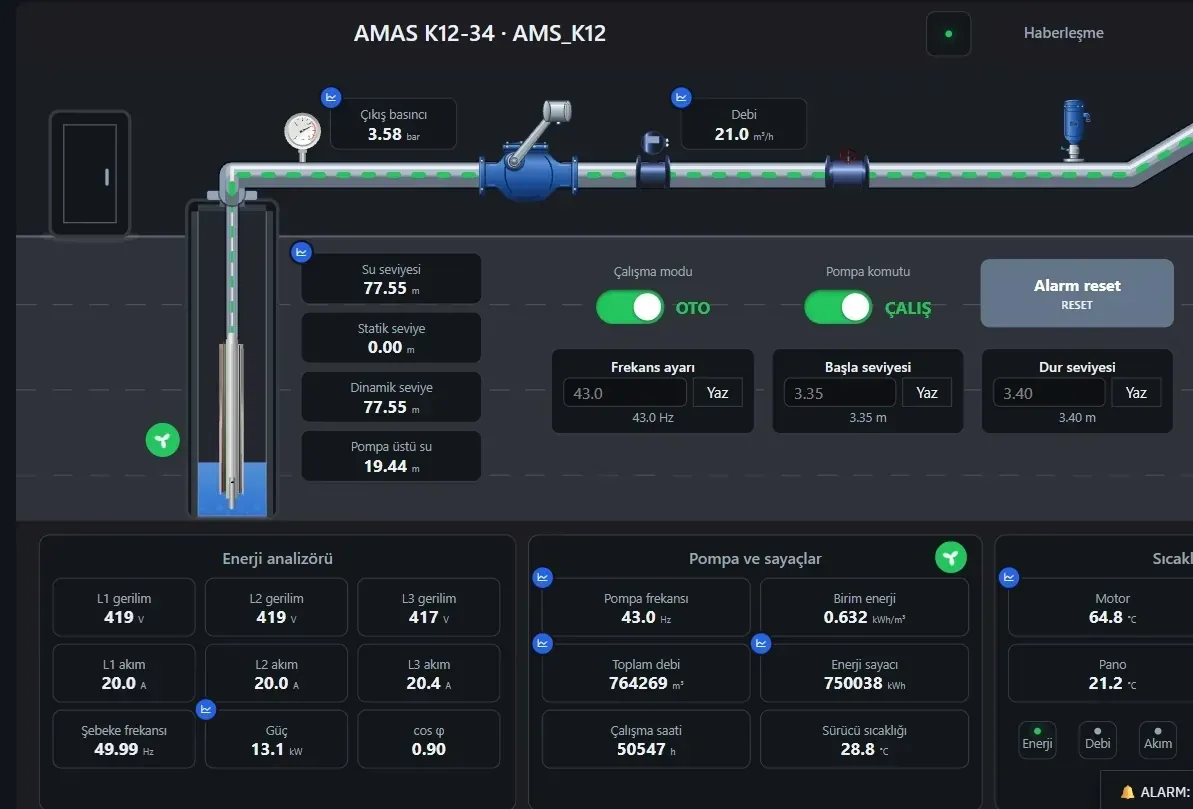
Control room · TV
The control-room TV cycles through device health, communications status and historical well readings. New events run along the ticker; a high-priority alert shows its source and time to the shift.
Explore control-room views(opens in a new tab)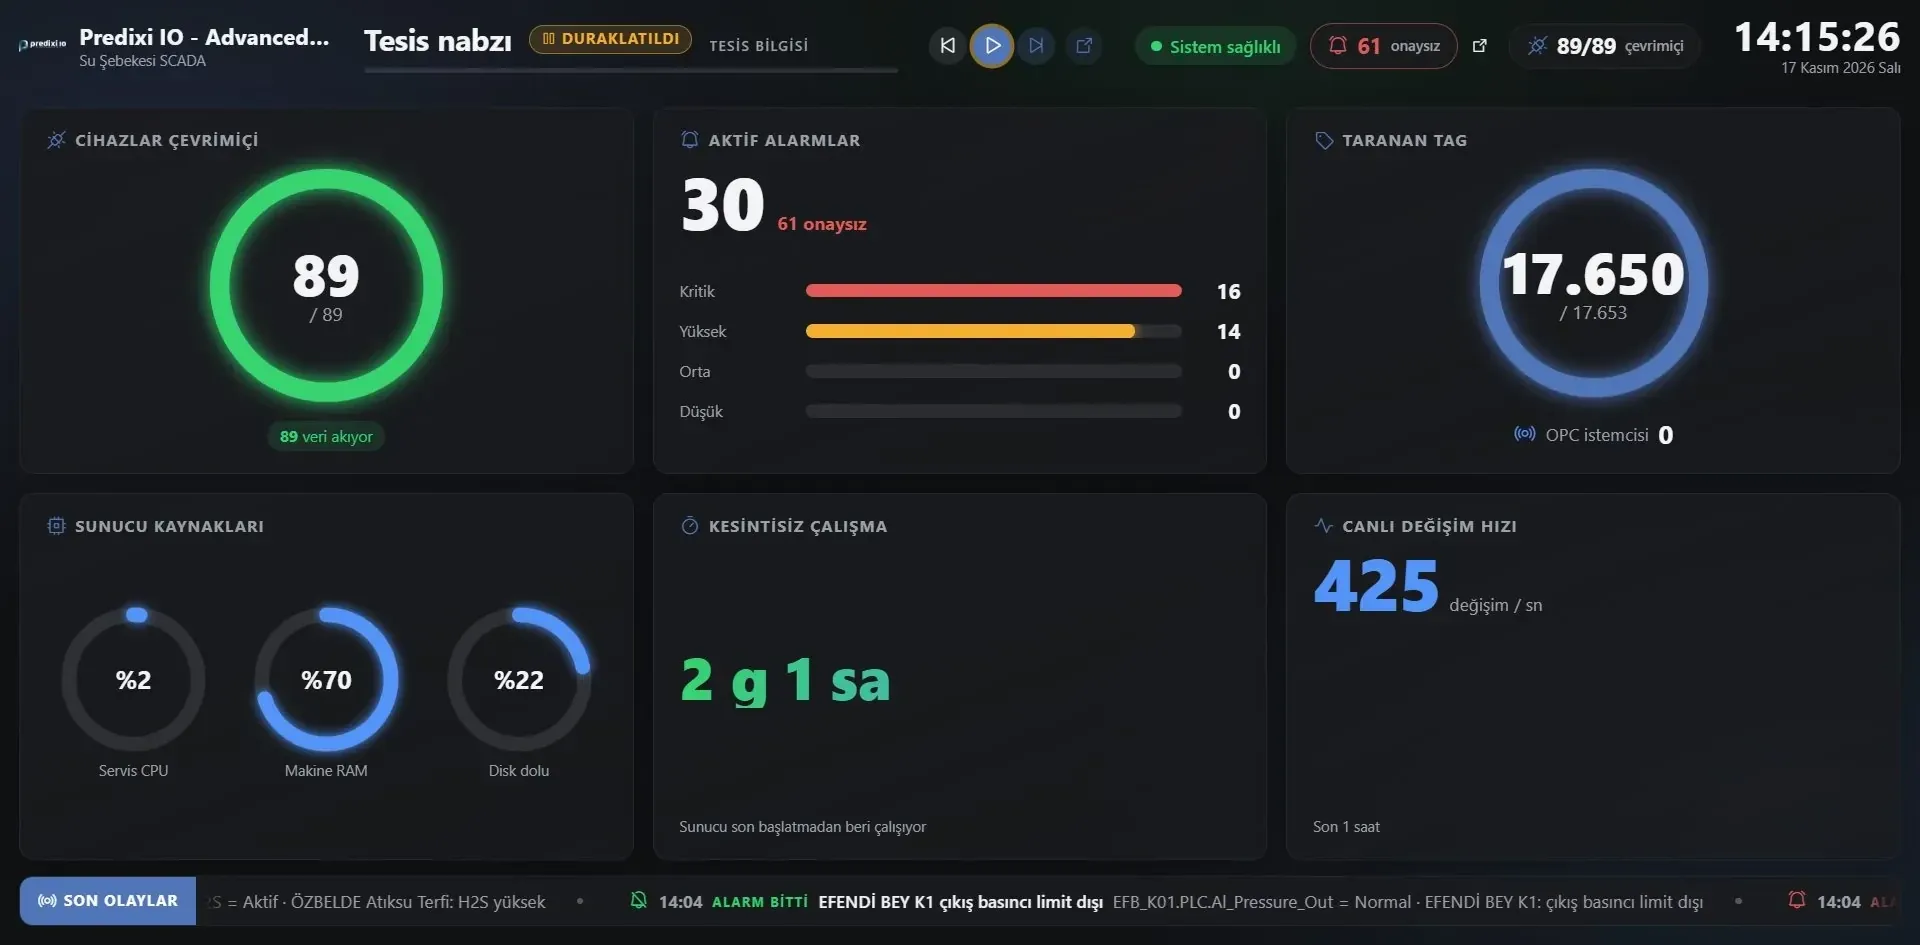
Trends and reports
Compare motor temperatures on a shared time axis. Share first and last values, change, minimum, maximum and mean for the period as CSV or PDF.
Explore reports(opens in a new tab)Visual automation
A workflow starts on an alarm, a tag, a webhook or a scheduled time. Example: a pressure alarm is logged, and at severity 600 or above the person on call receives an SMS.
Explore automation(opens in a new tab)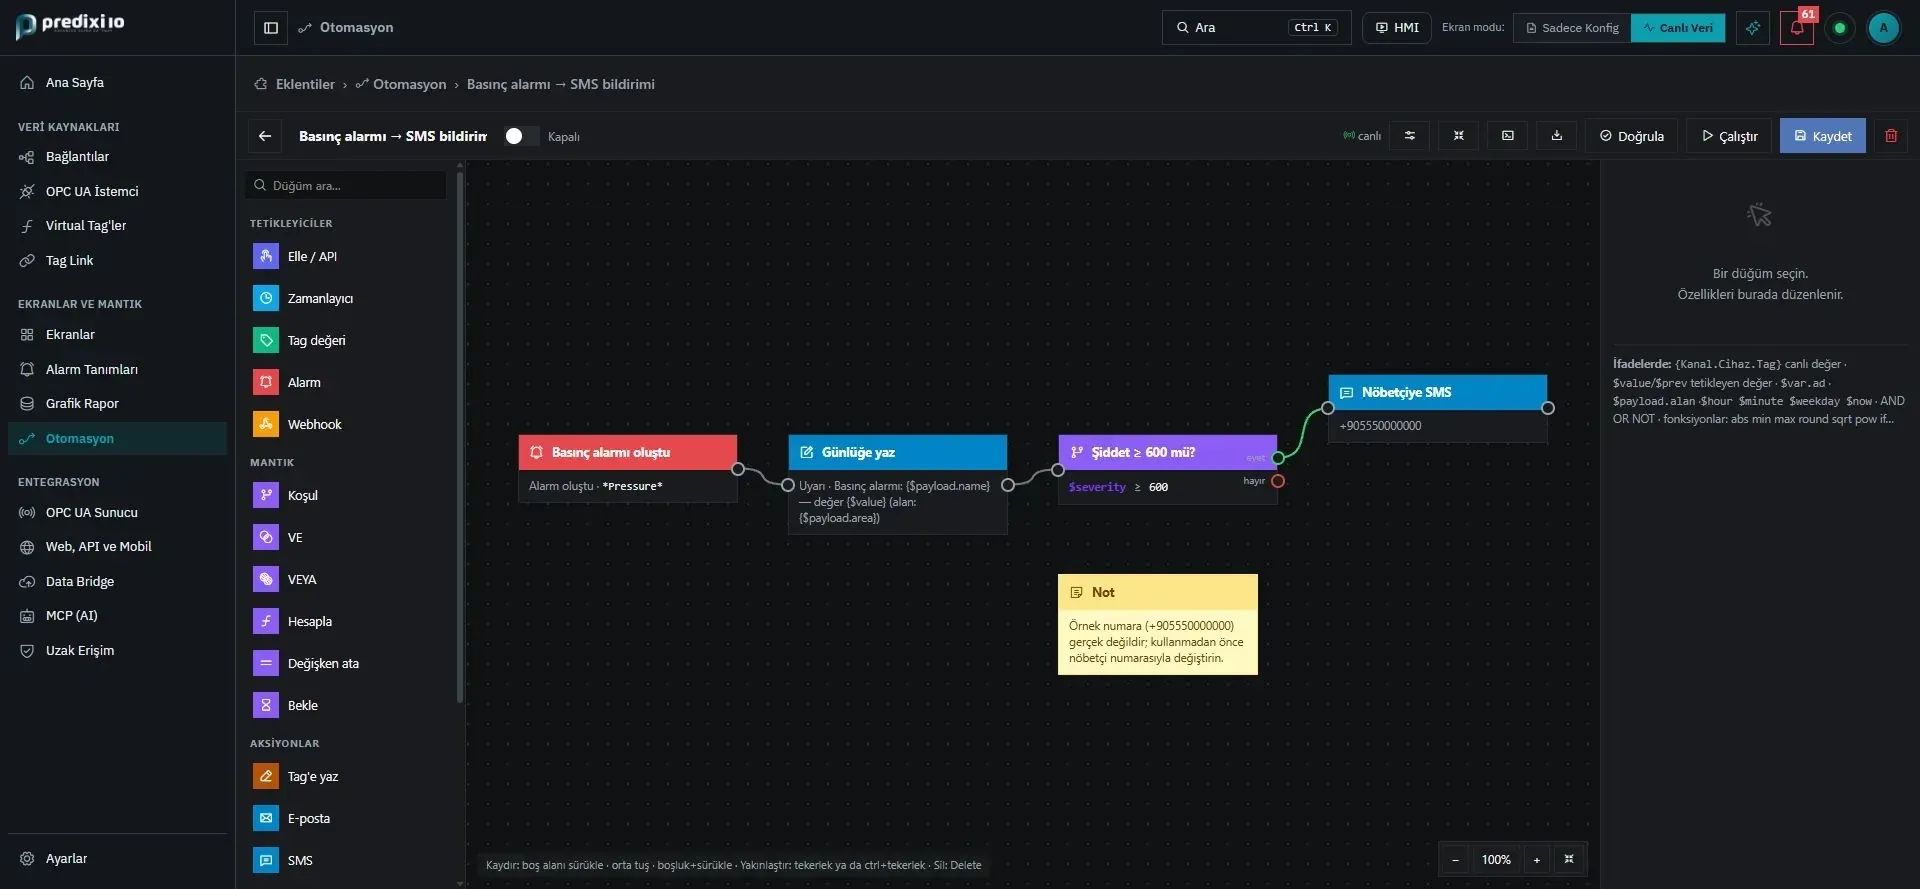
Distributed sites
The map shows each station’s location with its current operating state. In the field, staff check key figures and active alarms on their phones.
Explore distributed sites(opens in a new tab)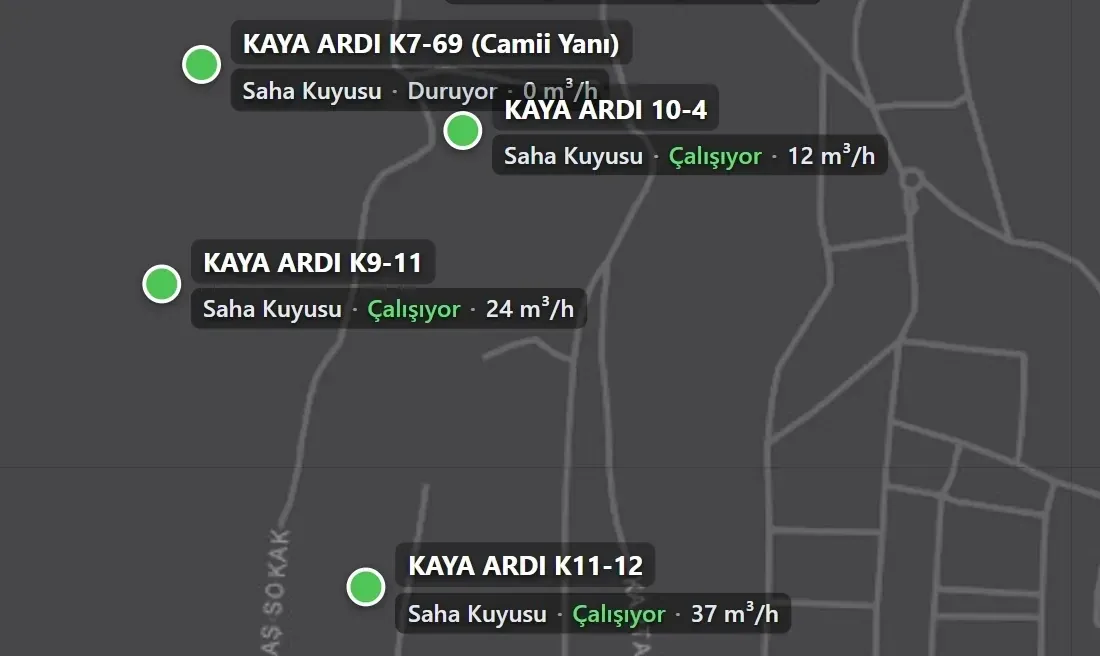
An operator asks which motor to inspect first. The assistant queries active motor-temperature alarms and compares the timestamps of unacknowledged records with the same severity.
It works through MCP: the tools it calls are shown in the conversation, and they can only query data they have permission to read.
The conversation below uses sample alarm data.
Explore the assistant(opens in a new tab)Which motor temperature alarm should I review first?
find_tools
list_alarms
AMAS K12-34. Its severity is 700, it has not been acknowledged and it is the oldest record at that severity, so I suggest inspecting this motor first.
A single field reading can feed a process screen, your existing SCADA system and a business application at the same time.
Field data sources
Predixi IO
Live readings and equipment state in one project.
Process screen
Operator HMI and control-room TV.
Existing SCADA
An OPC UA client reads from the Predixi IO server.
Business applications, ERP
Pull over REST; push with Data Bridge over MQTT or REST.
AI tools
Scoped permissions through MCP.
Predixi IO runs in the browser and in a mobile view on phones. Apps for iOS, Android, macOS, Windows and Linux are in preparation.
Sign in to your project in the browser: screens, alarms, reports and automation.
io.a.predixi.comField teams follow key figures on their phones; business systems connect over REST, OPC UA and Data Bridge.
Both products share the same field-driver layer and MCP-based AI access; they do different jobs.
| Predixi IO | Predixi WIS | |
|---|---|---|
| What it is | Industrial SCADA platform | Water management information system |
| Built for | SCADA engineers and operators of any process | Water utilities: management, operations, field and maintenance teams |
| Core job | Design HMI screens, bind live signals, run alarms and automation | Trace water from well to network and decide where to act |
| Data model | Project, screens and tags | Utility, district and station |
| Analytics | Trends, hourly values, period statistics, alarm reports | kWh/m³, cost per m³, meter differences, pump operating point, maintenance priority |
| Northbound | OPC UA server, REST, Data Bridge, MCP, remote access | REST API (stations, topology and pipes for GIS), MCP |
| Choose it when | You want to build a SCADA system for your own process, or carry PLC data into an existing SCADA or ERP system | You run a water network and need production, energy, cost and maintenance decisions across the utility |
Planning to use both together? Tell us about your system.
Share the product presentation with your team, or talk your project through with us.